| 2. Webinterface |
| |
|
|
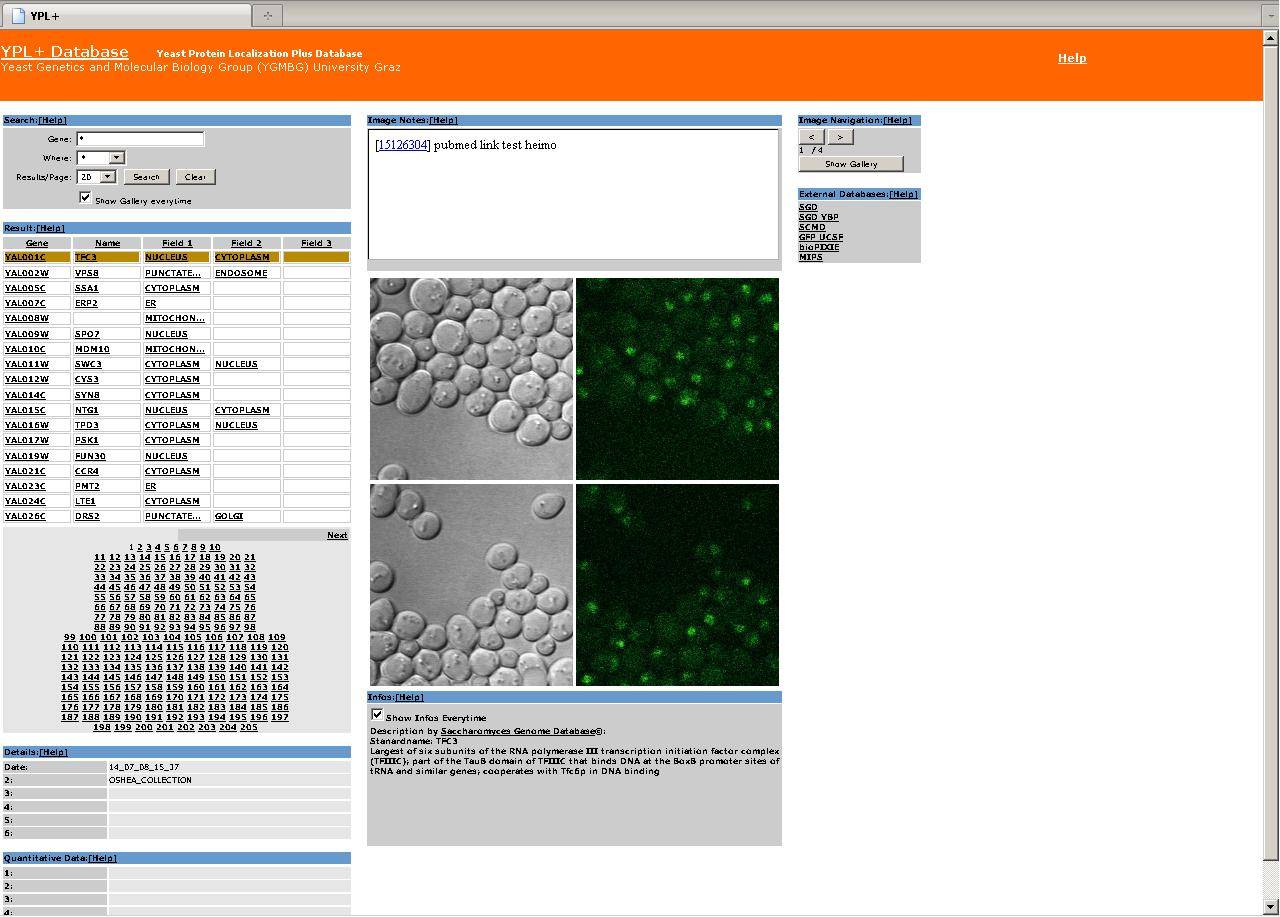
Interface organization:
I … Search Area
II … Results Area
III … Details Area
IV … Quantitative Data Area
V … Image Notes Area
VI … Image Area
VII … Info Area
VIII … Image Navigation Area
IV … Different Databases Area
|
The webinterface is organized in eight areas explained below.
It' s optimized for displays with a resolution of 1024x728 in
full screen mode.
|
| |
2.1 Search Area |
| |
|
|
Search fields:
I … Gene text field
II … Localization list field
III … Results per page field
IV … Show gallery everytime
|
The search area provides three fields, allowing you to search
for either a gene you are interested in or a localization pattern and how much results you want to see per page. Additional you have the option to show the gallery everytime.
|
| |
|
2.1.1 Gene search |
| |
|
The interface provides the following possibilities for searching
for a gene: using the search function, search for gene
names or wildcard search.
Wildcard search:
Enter '*' in the gene field and press the search button.
All available genes will be listed in the results area.
Alternatively you may search for all YAL genes with 'YAL'
|
| |
|
2.1.2 Localization
search |
| |
|
Search is possible for a specific or all available localizations.
Specific localization search:
Select one localization in the localization list and press
the search button. All available experiments with given localization
will be listed in the results area.
All localizations search:
Select the '*' localization in the localization list
and press the search button. All available experiments will
be listed in the result area (identical to a gene name wild
card search).
|
| |
2.2 Results Area |
| |
|
|
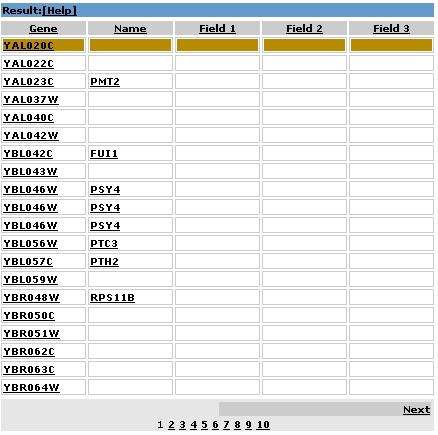
Result columns:
Gene … Gene names
Name … if available the systematic ORFs names
Field1, Field2, Field3 … localizations
|
The results of your search will be listed here.
|
| |
|
2.2.1 Show details
|
| |
|
The details for the first row of the results area are shown
in the details frame, construct, image and info area. Click
on your gene of interest in the results area to see details.
|
| |
|
2.2.2 Sorting |
| |
|
Clicking on the table headers 'Gene', 'Name', 'Field 1', 'Field 2', 'Field 3'
changes the sorting of the results. By default
results are sorted by gene names.
|
| |
2.3. Details Area |
| |
Details for the active images are displayed.
|
| |
|
2.3.1 Details Fields |
| |
|
1:
Date when the images where uploaded
2:
if available the name who uploaded the data
3:
Data Detail
4:
Data Detail
5:
Data Detail
6:
Data Detail
|
| |
2.4. Quantitative Data Area |
| |
Quantitative Data for the active images are displayed.
|
| |
|
2.4.1 Quantitative Data Fields |
| |
|
1:
Quantitative Data Detail
2:
Quantitative Data Detail
3:
Quantitative Data Detail
4:
Quantitative Data Detail
5:
Quantitative Data Detail
6:
Quantitative Data Detail
|
| |
2.5 Image Notes |
| |
Notes to the specific gene in the current database.
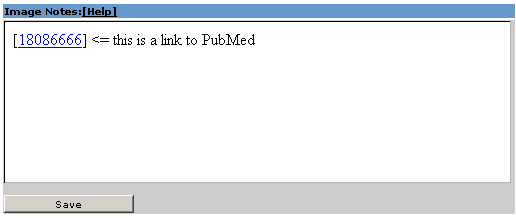
Additionaly you can set here links to PubMed. To do that, you need to write [PubMedID] or [PubMedID1,PubMedID2].
If you want to follow a PubMed link you have to hold 'STRG' and click on the link.
|
| |
2.6 Image Area |
| |
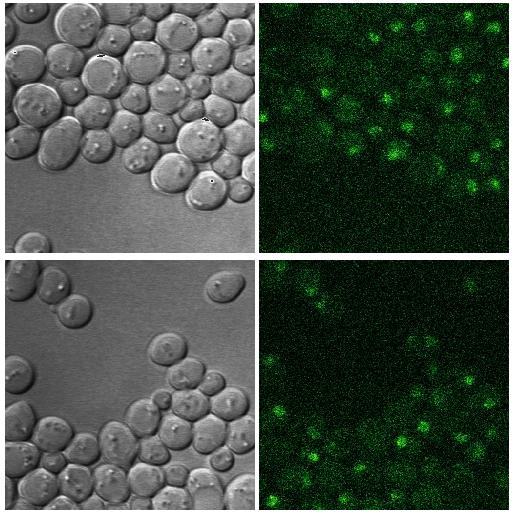
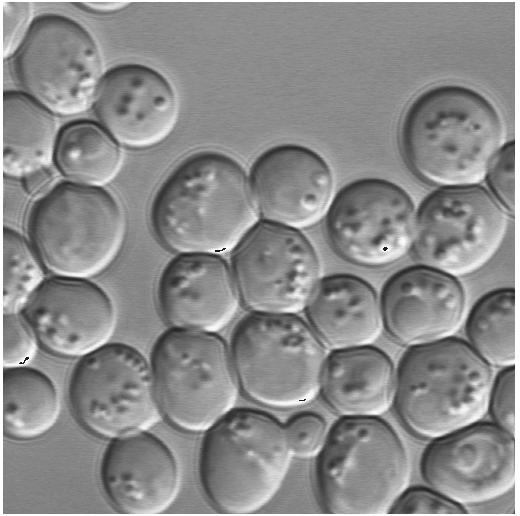
In the image area the image or the image gallery is shown.
|
| |
2.7 Info Area |
| |
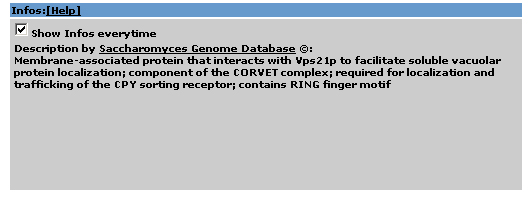
Additional information from the Saccharomyces Genome Database is shown. If you don't want to display it, just unclick the 'Show Infos Everytime'-box
|
| |
2.8 Image Navigation Area |
| |
|
|
Image Navigation bar:
I … Image scrolling
II … Show Gallery
|
Image scrolling … explained unter point 2.8.1 Image scrolling
Show Gallery … explained unter point 2.8.2 Gallery
|
| |
|
2.8.1 Image Scrolling |
| |
|
Browwsing through all images of an experiment is possible
by using the  buttons. The actual
number and the total count of images is shown below (3/4 means:
you see image number 3 of a total of 4 images). buttons. The actual
number and the total count of images is shown below (3/4 means:
you see image number 3 of a total of 4 images).
|
| |
|
2.8.2 Gallery |
| |
|
The image gallery gives an overview of all images for one gene
You can enlarge the actual image of the gene by clicking on it.
|
| |
2.9 Different Databases Area |
| |
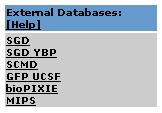
If you click on a database you will be redirected to the clicked database with the current gene.
|




 buttons. The actual
number and the total count of images is shown below (3/4 means:
you see image number 3 of a total of 4 images).